Market Data Bank
It was a strong quarter for stocks.
Stocks gained +7.5% in the first quarter of 2023, following a +7.6% gain in 4Q 2022.
The two quarters of strong, positive returns were preceded by three consecutive quarters of losses in the first, second, and third quarters of 2022, which started a bear market on June 23, 2022, that has continued into April 2023.
During the final three weeks of the first quarter, stocks overcame a sudden and unexpected threat to the banking system that began with the failure of Silicon Valley Bank.
Fear over risks to the U.S. banking system complicated the Federal Reserve’s aggressive 13-month-long monetary tightening campaign.
The Fed has hiked rates nine times and is attempting to lower inflation without triggering a recession.
The banking crisis rattled Wall Street following nine hikes in interest rates by the Federal Reserve since March 2022.
This has been one of the top-three most aggressive tightening campaigns since enactment of The Federal Reserve Act of 1913.
Only twice has the Fed waged a battle with inflation of a similar magnitude: in 1918, after World War I, and again in the late 1970s and early 1980s.
Rates were raised about 800% in 13 months.
The banking crisis also struck at a time when the index of leading economic indicators had declined for 11 straight months and the yield curve for months signaled a recession is likely in 2023.
The LEI and inverted yield curve are two time-tested indicators of coming recession.
But even as a recession—defined as two consecutive quarters of shrinking economic growth—could yet occur in 2023, the stock market, which reflects the bad and good news, is pricing in signs that the economy is in okay shape.
Moreover, economic fundamentals, the main mathematical factors that drive the U.S. economy, are indicating no recession is ahead.
Low growth but no recession is likely for 2023.
For example, the news on inflation, released Friday, March 31st, the last day of the quarter, was quite good.
The gray dotted lines in this chart show how the inflation rate hugged the 1.5% annual rate for over a decade and, after the pandemic struck and Russia invaded Ukraine, inflation skyrocketed in 2021 and the first six months of 2022, triggering the worst inflation in over four decades.
But look at how inflation has risen at a slower rate since July 2022.
The big question is how long it will take for inflation to decline back to the 2% annual rate targeted by the Federal Open Market Committee.
Federal Reserve policymakers are predicting inflation will continue to slow.
The gray dotted lines show the high and low range of forecasts made by central bankers at the last meeting of the quarter on March 22.
Central bankers expected the PCED inflation index to fall to between 2.2% to 2.8% by the end of 2023.
The Fed’s inflation forecast could be wrong.
Unexpected problems like the pandemic-related supply chain problems, the Russian war in Ukraine, and runs on small- and medium-sized banks could bring bad surprises.
However, if there are no additional problems, and problems in the banks are behind us, the Fed forecast could be correct, and an economic expansion may be already under way.
Meanwhile, in another positive sign, the personal savings rate ticked up.
The savings rate remained lower than before the pandemic broke out, but the cash from savings accounts was fueling consumer spending strength in the 12 months through February.
In 2020 and 2021, government stimulus checks, unemployment bonuses, and assistance to businesses after COVID-19 struck had swelled consumer checking and savings accounts, and that excess cash financed consumer spending.
Personal spending increased by 8.3% in the most recent 12 months—3.3% after inflation.
Stock posted a +7.5% gain in the first quarter of 2023. But let’s break that down and give you context for understanding what it means to managing a portfolio.
We give investment advice predicated on modern portfolio theory.
MPT is a large body of financial knowledge based on academic research done over the last 70 years.
This framework for investing is now taught in the world’s best business schools and embraced by institutional investors.
To reduce MPT down to basics, MPT is a way of limiting the risk of losing money for investments you commit to holding until you die, or for at least a couple of decades.
The world that investments revolve around is always changing, and not enough statistical history exists to make investment predictions with certainty.
MPT is a framework for managing that risk.
MPT is a quantitative approach to investing and is based on statistical facts at the intersection of investing and economics.
What’s happened in the past is relied upon to come up with an investment outlook based on economic fundamentals.
But it requires an understanding of the history of investing and economics.
MPT does not guarantee success, but its logic is embraced by pension funds and other institutional investors—the largest investors in the world.
In addition to classifying investments based on their distinct statistical characteristics, MPT imposes a quantitative discipline for managing assets based on history and fundamental facts about finance.
On top of the statistical knowledge about how assets behave based on MPT, a layer of knowledge of history and experience is added.
That layer is professional judgment, and it’s a distinguishing characteristic of this firm.
With that context, let’s look at key first-quarter 2023 investment analytics.
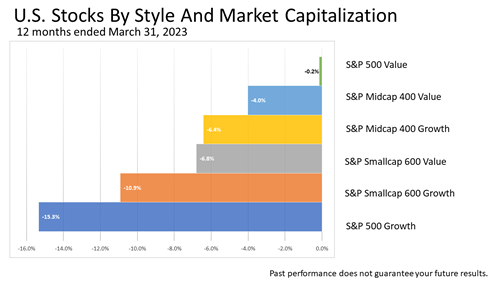
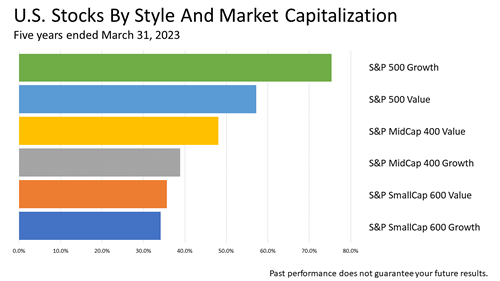
Value stocks outperformed in 2022, and growth stocks lagged. In fact, 2022 was the worst year in decades for growth stocks.
The trend reversed in the first quarter of 2023.
Large growth stocks led the way, with nearly double the gains of less volatile value stocks in the first quarter of 2023.
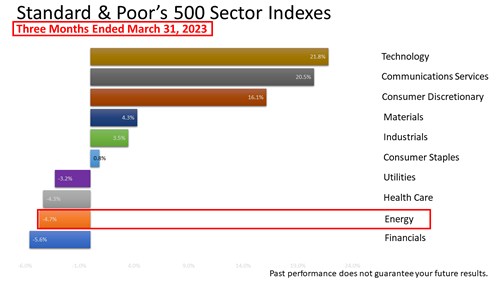
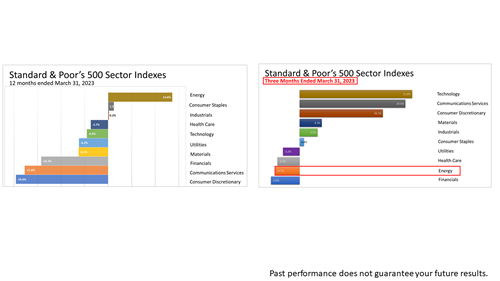
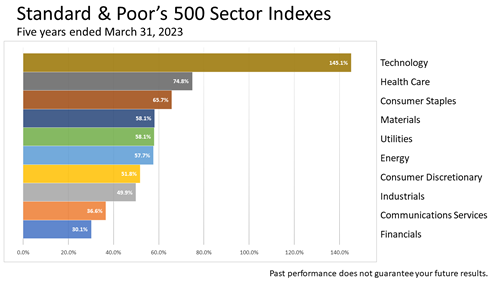
Companies in industry sectors that grow fast in periods of economic expansion, such as technology and providers of products to higher-income consumers with discretion to spend beyond their regular monthly expenses, led the way in the 1Q 2023.
Interest-rate-sensitive companies, such as utilities and financial companies, experienced losses.
Note that in this three-month period, energy stocks lost 4.7% of their value.
We’ll come back to that in a few minutes.
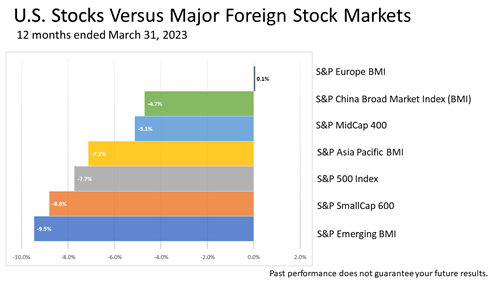
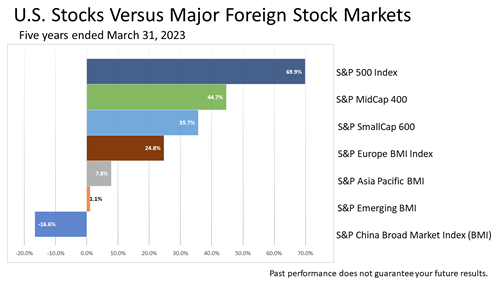
Europe outperformed U.S. stocks in the first quarter.
Despite the Ukraine war and high inflation, European equities outperformed U.S. stocks.
Europe managed to secure gas supplies and diversify its energy suppliers sooner than expected.
Moreover, the mild winter in the first quarter of 2023 boosted European stock prices.
Banking system instability helped propel gold prices.
The stock market peaked January 3, 2022, and began a decline that continued through the end of March 2023.
By June 23, 2022, as measured by the Standard & Poor’s 500 index, the stock market had declined more than -20%.
Between January 2022 and June 23, 2022, the S&P 500 had declined by -20%.
The post-pandemic bear market had begun and remained in place as the second quarter of 2023 started.
For the 12 months ended March 31, 2023, the stock market netted a -7.7% loss.
To be clear, stocks had gained +7.6% in the fourth quarter of 2022 and another +7.5% in the first quarter of 2023, but the bear market losses in Q2 and Q3 of 2022 canceled out the gains of the past two quarters.
The bear market could be ending, though you may not know looking at this chart.
Here’s additional perspective on what’s been happening with stocks.
Just three months ago, at the end of the fourth quarter of 2022, the S&P 500 stock index was down -18.1% over the previous 12 months.
Fast forward three months, and the 12-month trailing loss has been narrowed from -18.1% to -7.7%.
The hardest-hit stocks in the bear market have been growth stocks, while value stocks have suffered the least in the 12 months ended March 31, 2023.
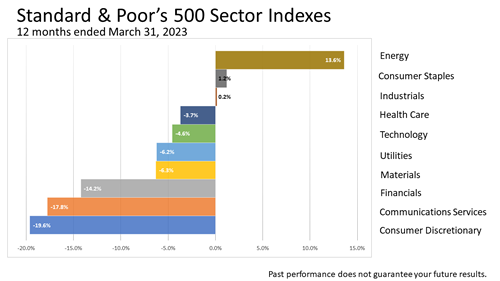
For the 12 months ended March 31, 2023, energy sector stocks led the 10 industry sectors that comprise the S&P 500 stock index.
However, as we mentioned when we showed you this slide a few minutes ago, the energy sector stock index lost -4.7% in the most recent three-month period.
Predicting the results of an industry sector is hard, and it is even harder to predict the price of an individual stock.
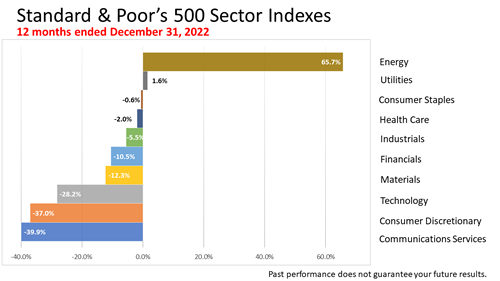
Again, with a +66% return only one quarter ago, energy stocks were at the top of the 10-sector performance ranking over the previous 12-month period.
Energy was one of only two sectors in the period with a positive return, and its return was about 40 times the one other sector with a gain, utilities.
However, the Standard & Poor’s energy sector stock index lost -4.7% in the most recent three-month period.
Predicting the results of an industry sector is hard, and it is even harder to predict the price of an individual stock.
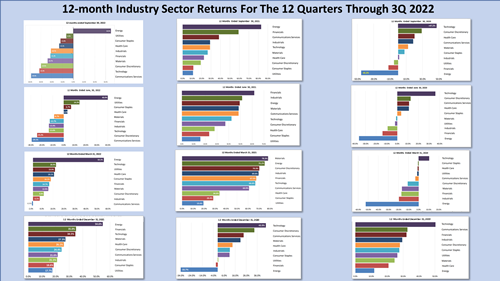
To reinforce the point about how unpredictable sector performance is, here are 12-month industry sector returns for the 12 quarters preceding the fourth quarter of 2022.
They show why it is so difficult to predict markets.
Each snapshot shows 12-month returns on the 10 industry sectors comprising the Standard & Poor’s 500 index.
The way to read this set of charts is by starting with the third quarter of 2022, in the upper left, and reading down to see the previous quarter.
The 12-month returns are shown going back to the last quarter of 2019.
What stands out is that energy industry stocks were the top-performing industry sector for five quarters but were the worst performers for five quarters in a row starting with the final quarter of 2019.
To capture the large gains on energy shares, you would have had to hold on to energy stocks through the dog days of 2020, when energy share prices plunged during the COVID-19 partial shutdown of the economy.
COVID was a 100-year risk and totally unexpected.
No one predicted it!
This is important evidence of how unpredictable the future of markets always is.
Going through this bit of history may help you stay focused on a strategic investment plan.
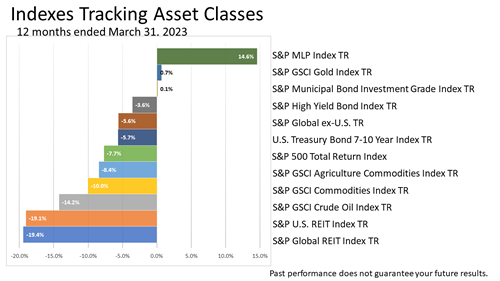
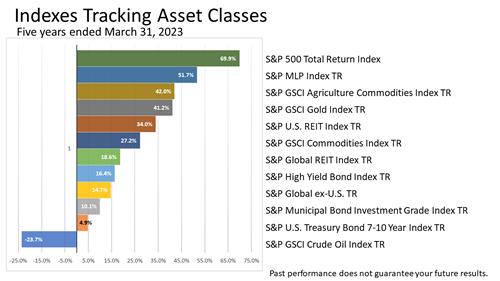
The bar chart shows returns on 13 different asset classes represented by indexes.
The top performer for the 12 months shown was the S&P Master Limited Partnership (MLP) Index, which provides investors with exposure to partnerships that trade on the NYSE and NASDAQ.
The index includes both master limited partnerships and publicly traded limited liability companies, which have a similar legal structure to MLPs and similar tax benefits. The index, which is largely dominated by energy holdings of MLPs in energy transportation and storage, outperformed the energy sector because of its niche in storage and transportation.
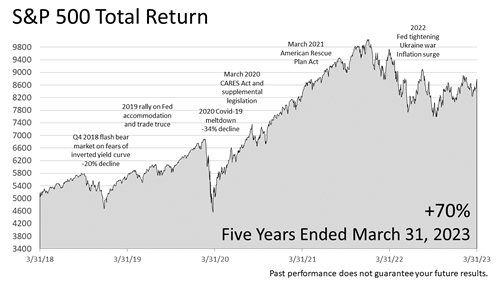
After trading sideways for approximately two years in 2015 and most of 2016 (not without hitting two air pockets during that period), the stock market broke out of that range after the November 2016 election. It rose steadily to an all-time peak on September 20, 2018, whereupon it dove by -20% on investor fears that an inverted yield curve was imminent.
On January 4, 2019, the Fed signaled rates were on hold, whereupon stocks rallied for most of the remainder of 2019.
In February of 2020, stocks hit a new all-time peak, whereupon the COVID-19 virus put the economy and the stock market into meltdown.
By early September of 2020, stocks hit a record all-time high following the enactment of the CARES Act and related legislation.
After a pause, stocks rallied steadily from the November 2020 election through the end of 2020.
Stocks continued upward through the first quarter of 2021 following March enactment of the $1.9 trillion American Rescue Plan Act—despite the Omicron COVID variant—through the end of 2021.
The S&P 500 peaked January 3, 2022, and started a decline in the first quarter on worries over Fed tightening and Russia’s invasion of Ukraine.
They continued lower through the second and third quarters of 2022, rallied in the fourth quarter of 2022, and rallied again in the first quarter of 2023.
Over the last five years, including dividends, the S&P 500 Total Return index has gained +70%.


